Before we get to the list this is what you can read on page 10:
We’re on the road to nowhere …
And now the statements …
1. This growth [in population from 310,100 (2021) to 365,000 (2041)] will not be possible without an integrated and sustainable transport network that allows everyone to travel from home to school, work and other key destinations across the borough and beyond, to keep Redbridge moving. (p6). All else being equal, more people means more car journeys means Redbridge grinds to a halt. Somethings gotta give, on yer bike – it takes up less road space.
2. Public transport (e.g. bus, underground and rail) and active travel (walking, wheeling, cycling and scooting) networks are fragmented … and not well connected to green spaces or other key infrastructure in the borough such as transport links and places of work (p8). An honest assessment of where we are. Now’s the time for some joined up thinking.
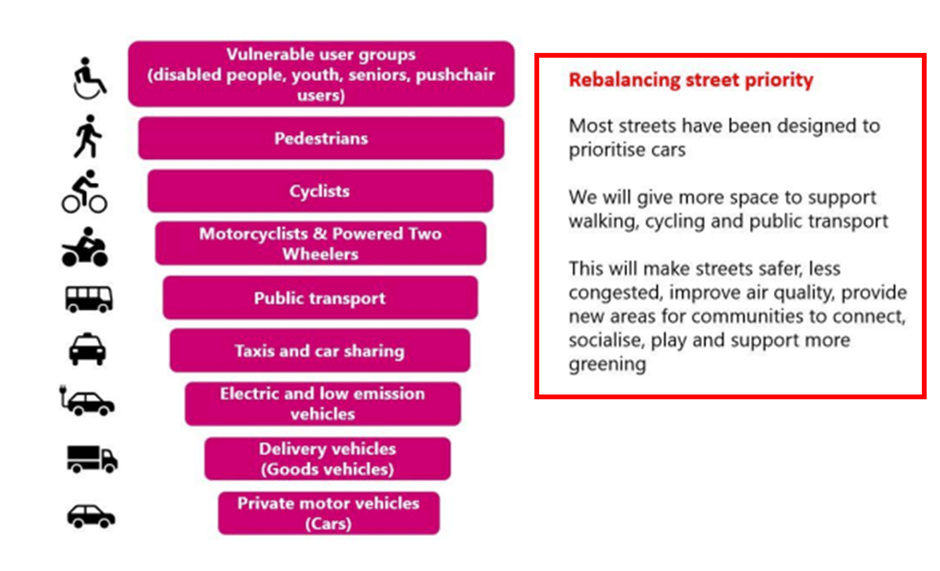
3. Road user hierarchy for Redbridge
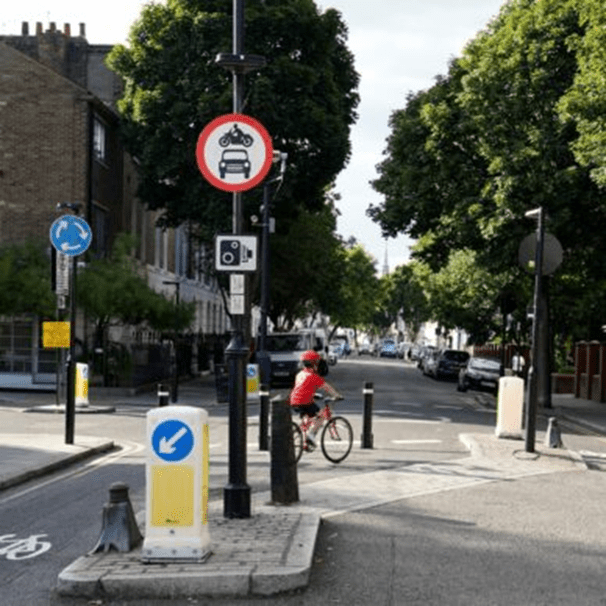
As night follows day, we can’t build more roads for more cars so to keep Redbridge moving we need more people to walk, cycle and take the bus. These are not virtual activities: space is required and there is only one place to find it.
4. To keep Redbridge moving the option to choose and use sustainable travel options that involve walking, wheeling, cycling and use of public transport is needed (p15). That’s sorting out dangerous junctions, putting cycle tracks along main roads, reducing traffic speeds and turning rat runs into quiet streets. 17 years is enough time.
5. The transport network will enable people to access key destinations, community services and green spaces by sustainable travel options, (p17). As above.
6. The figure provides an insight into how different neighbourhoods, centres and roads should be characterised to keep Redbridge moving and importantly rebalance street priority to ensure vulnerable user groups pedestrians and cyclists feel safe
By our reckoning that’s most of the Borough’s Road network suitable for cycling which means, Borough wide, sorting out dangerous junctions, putting cycle tracks along main roads, reducing traffic speeds and turning rat runs into quiet streets. There’s a bit of a theme emerging here …
7. At least 2/3 of all journeys will be by public transport, walking, wheeling (i.e. using of (sic) wheelchairs and mobility scooters), cycling or scooting. (p7). Surely a typo? If Redbridge does what it says it wants to do, by 2041 4/5ths is possible isn’t it?
Over the next month we will put up some posts on our website covering issues raised in the consultation that we think are worth responding to. For example, we think the strategy should include creating networks of ‘cycle streets’ that residents can use to cycle in comfort to the Borough’s railway and underground stations, schools, town centres and parks. The strategy covers 17 years (to 2041), so there’s plenty of time …
So, you might want to leave making your response until closer to the closing date (5th January 2025) and after you’ve read our posts.
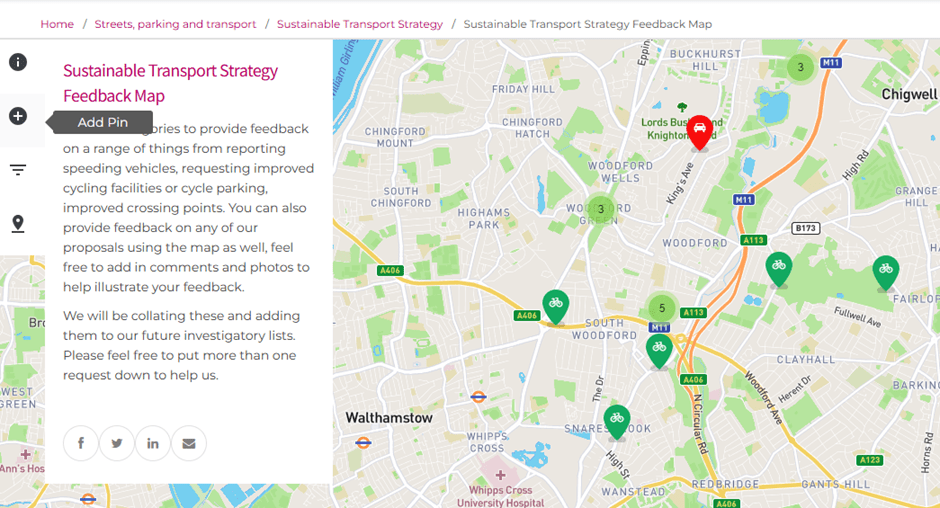
At the bottom of the page there is a button that takes you to a map.
You can add pins to the map and make a comment or suggestion. Clearly this is more relevant to the here and now than 2041 but anyway ….
We can see some people have already put up some good suggestions. For example, we like the suggestion to put in protected cycle tracks on the inclines on Herman Hill to prevent motor vehicles close passing cyclists as they slowly pedal up. It’s a modest proposal but it would make a difference.
We’d encourage you all to use the map. If we all do, we think the map could provide a comprehensive picture of what Redbridge can do over the next few years to make cycling the obvious choice for local journeys.
Some of you with long memories may remember that a few years ago Redbridge encouraged us cyclists to do something similar. At various meetings we heard various excuses as to why the data hadn’t been compiled and then it wasn’t going to be compiled. To all intents and purposes, the data is now lost.
So, this time we have decided to create our own shadow map so we can be sure the data is not lost – so you can post with confidence.
The survey
The survey comprises 24 questions. 7 questions are for the purpose of equalities monitoring, 6 ask for information about your travel habits and 7 ask for your opinion on aspects of the strategy. All these questions are closed and require you to choose an option from a list. We think they are very much focussed on the here and now rather than where we might want to be in 2041
There are 4 open questions – questions 7,11,16 and 17 – that give you the opportunity to say what you think about the strategy. 7, 11 and 16 are very poorly worded but you can get the gist of what’s being asked.
Email
If you want to make a bespoke response – maybe you have some very specific ideas and want to include photos – then you can send an email to sts@redbridge.gov.uk.